I think that one of the most powerful features of Looker Studio, formerly Google Data Studio, is its ability to allow us to produce new data from existing data through calculated fields. Not surprisingly, they are the essence of any business intelligence platform. Needed calculations let you create new dimensions and metrics from your data in order to extend and transform the information in your data sources.
They can also be adopted with various data types, and a large number of functions and aggregations, making the calculated results incredibly dynamic and unlimited.
I have created this detailed article to help you get started. You will have a comprehensive view of the calculated fields and how you can use them to add new dimensions to your reports.
In this article
HOW CALCULATED FIELDS WORK
According to Google’s definition, a calculated field is “a formula that performs some action on one or more other fields in your data source”. This means that you can handle calculations and functions to the data to perform new metrics and dimensions.
Looker Studio provides a number of powerful functions that can be used inside of calculated field formulas. The types of function that we can use are:
- Aggregation (AVG, COUNT, SUM…)
- Arithmetic (LOG, ROUND, SQRT…)
- Conditional (CASE, IF…)
- Date (DATE_DIFF, TODATE…)
- Geo (TOCITY, TOREGION…)
- Miscellaneous (CAST, IMAGE…)
- Text (CONCAT, REPLACE…)
As you can imagine, these functions are extremely powerful and useful, and it is important to know how to use them in the best way to get the most out of your data.
CALCULATED FIELDS IN DATASOURCE
There are two types of calculated fields, depending on where you decide to create them:
- In the Data Source;
- Specific charts in report.
As you might expect, each kind of calculated field brings out certain advantages and disadvantages. In this section, we will start describing these new calculations created in the data source.
First of all, I have to say that there are two possible places where you can create a calculated field in the data source schema. Let’s go ahead and see where we can find them.
Start by connecting a dataset and adding a chart to your page.
Click on “Add a field” at the bottom of the list of dimensions and metrics.
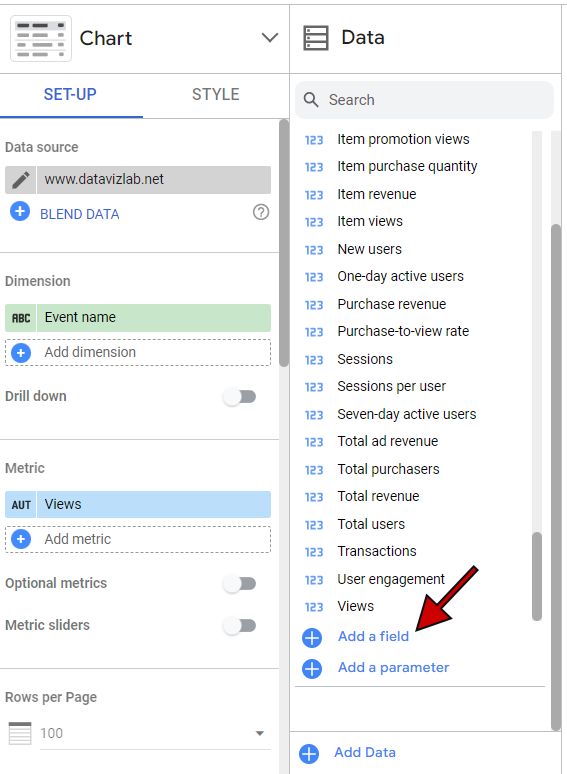
Now you can create a calculated field and add it to your chart.

Otherwise, follow the path below and click “ADD A FIELD” at the top right of the screen.
Resource > Manage added data sources > Edit

When you create calculated fields in a data source:
- Those fields are immediately available in every report that utilizes that specific datasource schema.
- They can be used easily like a normal field in any charts, controls, and other calculated fields.
Limitations of Data Source Calculated Fields
- You cannot use a data source calculated field when working with blended data.
- If you want to create or edit calculations, you need to have editing permission.
CHART-SPECIFIC CALCULATED FIELDS
These fields are created directly within a chart in your report. To do so, you will first need to highlight your chart, go under the sections Dimension or Metric, and choose to click on “Add dimension” or “Add metric“.
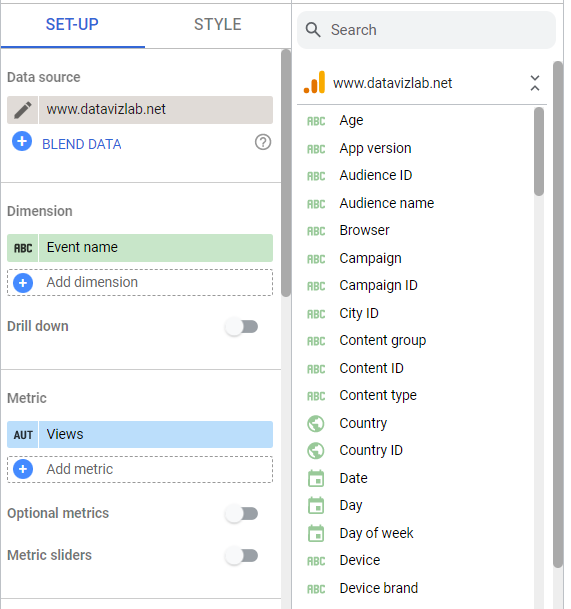
Once you click “Create Field,” the window where you can create the calculated field will appear.
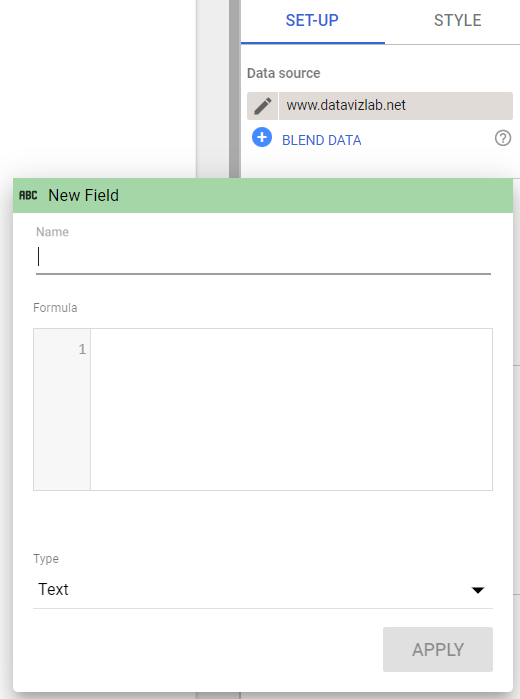
When you create calculated fields:
- Fields can be added easily without needing access to the data source.
- If you decide to use the blending data method, you can create a chart-specific calculated fields based on multiple data sources.
- Data source calculated fields can be included in chart-specific calculated fields.
Limitations of Chart-Level Calculated Fields
- Chart-level calculated fields will exist only in the chart in which they are created. This means these new fields will not be automatically available in the data source for the chart.
- You cannot reference other chart-specific calculated fields in your formula, even if those fields are defined in the same chart. (If you need to refer to other calculated fields, you will have to use a data source calculated field).
- In order to generate chart-specific calculated fields, you need to be an editor of the report.

